
Technical analysis patterns, such as higher highs, lower lows, rising parallel channels, and falling parallel channels, form the foundation of smart trading strategies in financial markets. These recurring patterns help traders predict price movements by analyzing historical data and market trends. Mastering these tools is essential for navigating the complexities of trading, identifying opportunities, and managing risks effectively. In this guide, we explore the significance of these patterns and their application in building robust trading strategies.
What Are Technical Analysis Patterns?
Technical analysis patterns are recurring shapes or trends observed in price charts that suggest potential future market movements. These patterns are formed due to collective trader behaviors and are essential for identifying trends, reversals, and continuation phases in the market. Understanding these patterns empowers traders to make informed decisions, mitigate risks, and capitalize on opportunities.
Key Patterns in Technical Analysis
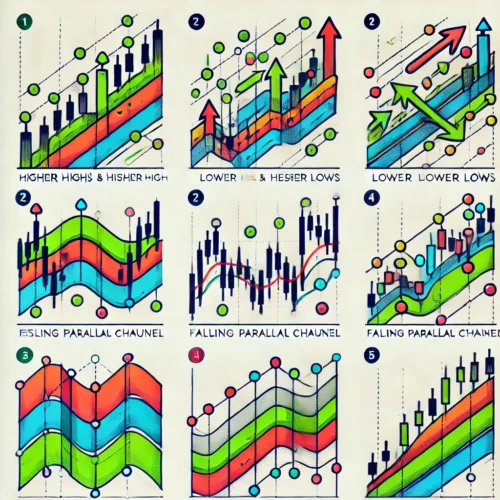
1. Higher Highs (HH) and Higher Lows (HL)
- Definition: Higher highs occur when the price peaks are consistently higher than the previous peaks, while higher lows form when troughs are higher than the preceding ones.
- Significance: This pattern indicates a strong uptrend, showcasing buyer dominance.
- Trading Implications: Traders often look to buy during the formation of higher lows, expecting the uptrend to continue.


Example: In an uptrend:
- Peak 1: $100
- Peak 2: $110 (Higher High)
- Trough 1: $90
- Trough 2: $95 (Higher Low)
2. Lower Highs (LH) and Lower Lows (LL)
- Definition: Lower highs are price peaks lower than the previous ones, while lower lows are troughs lower than their predecessors.
- Significance: This pattern signals a downtrend, indicating seller dominance.
- Trading Implications: Traders often consider selling during the formation of lower highs, anticipating further declines.


Example: In a downtrend:
- Peak 1: $100
- Peak 2: $95 (Lower High)
- Trough 1: $90
- Trough 2: $85 (Lower Low)
3. Rising Parallel Channel
- Definition: A rising parallel channel is a chart pattern where the price oscillates between two upward-sloping parallel trendlines, with higher highs and higher lows.
- Significance: This pattern reflects a strong uptrend, but traders should watch for potential breakout or breakdown scenarios.
- Trading Implications: Traders often:
- Buy: Near the lower trendline.
- Sell: Near the upper trendline.
- Monitor: For a breakout above the upper trendline for aggressive buying opportunities or breakdowns for bearish moves.


Example: For example in the above chart we are showing a upper trend but breakdown happen in lower, where it is doing retesting and then going down, it means it is creating a bearish trend.
4. Falling Parallel Channel
- Definition: A falling parallel channel forms when the price oscillates between two downward-sloping parallel trendlines, showing lower highs and lower lows.
- Significance: This pattern indicates a downtrend but can also signal reversal opportunities if a breakout occurs.
- Trading Implications:
- Sell: Near the upper trendline.
- Buy: Near the lower trendline if a reversal is anticipated.
- Monitor: For a breakout above the upper trendline for bullish signals.


Example: For example in the above chart we are showing a downward trend but breakdown happen in upper side, where it is doing retesting and then going up, it means it is creating a bullish trend.
Advanced Chart Patterns
1. Head and Shoulders
- Definition: A reversal pattern characterized by three peaks—the middle peak (head) being the highest, flanked by two lower peaks (shoulders).
- Significance: Indicates a potential reversal from an uptrend to a downtrend.
- Trading Implications: Traders look for a break below the neckline for bearish signals.


2. Double Top and Double Bottom
- Double Top: Formed when the price reaches a high point twice but fails to break above, signaling a reversal to a downtrend.
- Double Bottom: Occurs when the price hits a low point twice but doesn’t break below, indicating a reversal to an uptrend.


3. Flags and Pennants
- Flags: Rectangular-shaped continuation patterns that slope against the prevailing trend.
- Pennants: Small symmetrical triangles that consolidate before the trend resumes.
- Significance: Both are continuation patterns signaling brief pauses in the trend.


How to Trade Using These Patterns
Step 1: Identify the Trend: Analyze the broader market trend to determine whether it’s bullish, bearish, or range-bound.
Step 2: Recognize the Pattern: Identify patterns such as higher highs, lower lows, or parallel channels to predict future price actions.
Step 3: Set Entry and Exit Points:
- Place entry orders at key levels, such as support or resistance lines.
- Use stop-loss orders to mitigate risks.
Step 4: Confirm with Indicators: Complement patterns with indicators like moving averages, RSI, or MACD to validate predictions.
Common Mistakes to Avoid
- Ignoring the Bigger Picture: Always analyze patterns within the broader market context.
- Over-Reliance on Patterns: Use patterns alongside other tools for comprehensive analysis.
- Neglecting Risk Management: Always use stop-loss and position-sizing strategies.
- Misidentifying Patterns: Ensure accurate identification by cross-checking with historical data.
Conclusion
Technical analysis patterns like higher highs, lower lows, and rising or falling channels equip traders with actionable insights. These patterns, combined with robust trading strategies and risk management, can significantly enhance decision-making. In today’s dynamic markets, mastering these tools is not just an advantage—it’s a necessity for success.
By focusing on these principles, traders can navigate the complexities of financial markets and build a disciplined approach to trading, ultimately leading to consistent profitability.