Technical analysis is a method of evaluating stocks, commodities, or other financial instruments by analyzing statistical trends gathered from trading activity, such as price movement and volume. In the context of the Indian stock market, technical analysis serves as a valuable tool for traders and investors aiming to predict future price movements based on historical data.
This blog delves into the essentials of technical analysis, providing a comprehensive guide tailored to the nuances of the Indian stock market.
What is Technical Analysis?
Technical analysis involves studying price charts, trading volumes, and patterns to forecast market trends. Unlike fundamental analysis, which focuses on a company’s financial health and economic factors, technical analysis relies solely on price and volume data.
In the Indian stock market, where retail participation has grown significantly in recent years, technical analysis is increasingly used to make informed decisions. Traders analyze patterns, trends, and indicators to time their trades effectively.
Key Principles of Technical Analysis
- Market Discounts Everything: Technical analysis assumes that all relevant information, such as economic conditions, earnings reports, and geopolitical events, is already reflected in the stock’s price.
- Prices Move in Trends: Stock prices often move in identifiable trends—upward, downward, or sideways. Recognizing these trends is essential for making trading decisions.
- History Repeats Itself: Human psychology and market behavior often lead to recurring patterns. These patterns form the basis of many technical analysis tools and strategies.
Tools and Techniques in Technical Analysis
Time Frames for Technical Analysis
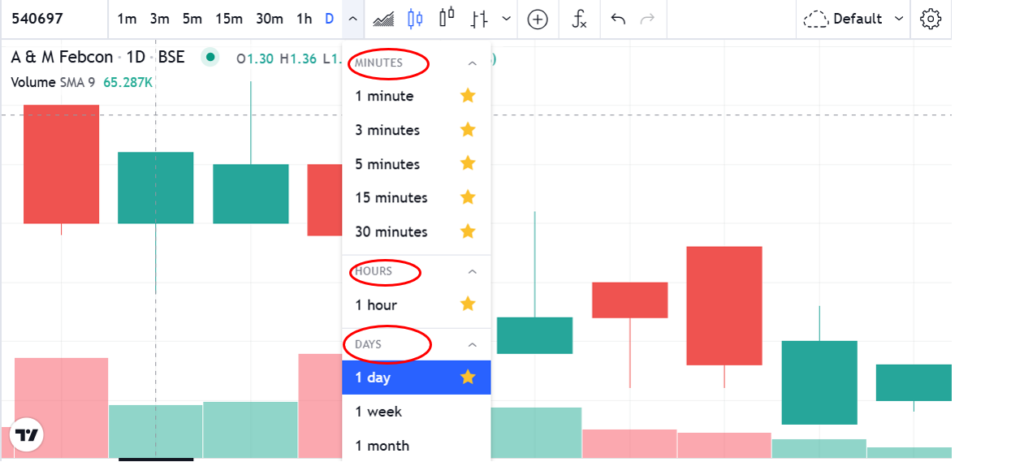
The choice of time frame for viewing candlestick charts depends on the type of trader you are:
- Scalper Traders :Use a time frame of 1 to 15 minutes. These traders aim to profit from small price movements within very short periods.
- Day Traders: Prefer a time frame of 15 minutes to 1 hour. They enter and exit trades within the same trading day.
- Swing Traders: Utilize a time frame of 4 hours to 1 day. They aim to capture short- to medium-term price movements over days or weeks.
- Position Traders: Focus on time frames of 1 day to 1 week. These traders hold positions for longer durations, often based on broader trends.

What are candlesticks: Basic structure & Interpretation
Candlesticks are one of the most widely used tools in technical analysis, especially in the Indian stock market. They provide a visual representation of price movement and are instrumental in identifying market trends, reversals, and patterns. Learning how to read and interpret candlesticks is essential for any trader or investor.
Size and Color:
The size of the candlestick body reveals the intensity (Buying & Selling) of market movement.

The color shows whether the session was Bullish (Green) or Bearish (Red).

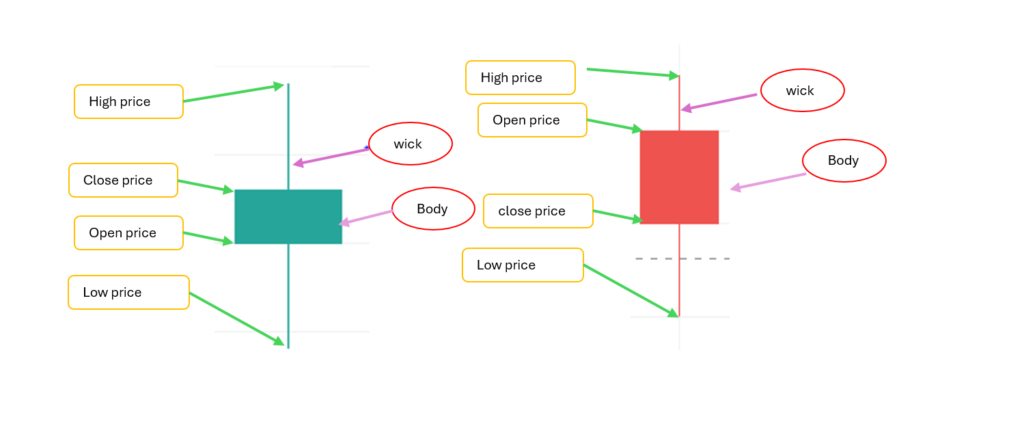
Structure of Candle :
Each candlestick provides four critical pieces of information:
- Open: The price at which the security began trading during the period.
- Close: The price at which the security ended trading during the period.
- High: The highest price traded during the period.
- Low: The lowest price traded during the period.

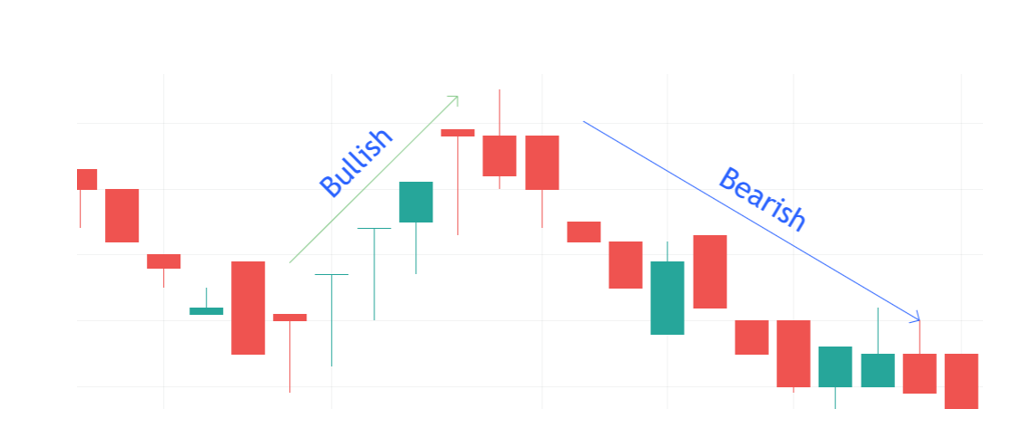
Market trends
Uptrend (Bullish Trend)
An uptrend is characterized by a series of higher highs and higher lows in stock prices.
- Indicators:
- Increasing demand for stocks.
- Positive market sentiment.
- Higher trading volumes.
- Causes:
- Strong economic growth.
- Positive corporate earnings reports.
- Favorable government policies or reduced interest rates.
- Investor Strategy:
- Investors often adopt a “buy and hold” strategy or increase their investments during an uptrend to maximize gains.
Downtrend (Bearish Trend)
A downtrend is marked by a sequence of lower highs and lower lows in stock prices.
- Indicators:
- Decreasing demand for stocks.
- Negative market sentiment.
- Declining trading volumes.
- Causes:
- Economic downturns.
- Poor corporate earnings.
- Geopolitical instability or rising interest rates.
- Investor Strategy:
- Investors may sell stocks to minimize losses or adopt defensive strategies like investing in safe-haven assets (e.g., gold, bonds).
Sideways Trend (Range-Bound Market)
A sideways trend occurs when stock prices move within a relatively narrow range without forming distinct higher highs or lower lows.
- Indicators:
- Stable trading volumes.
- Prices fluctuate within support and resistance levels.
- Causes:
- Uncertainty in the market.
- Lack of major economic or corporate news.
- Investor Strategy:
- Traders often focus on short-term strategies like range trading, buying at support levels, and selling at resistance levels.

Some Basic candle & its character
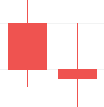
Masubuse Candle: It represents a strong directional move and is a single candlestick pattern.
- Bullish Masubuse: Opens at the low of the day and closes near the high, indicating strong buying pressure.
- Bearish Masubuse: Opens at the high of the day and closes near the low, showing strong selling pressure.
- Characteristics:
- Long body with minimal or no wicks.
- Indicates strong conviction in the market’s direction.
- Often occurs during trends, signaling their continuation or reversal.
- Significance:
- In an uptrend: Confirms bullish momentum.
- In a downtrend: Confirms bearish momentum.
Hammer: A hammer is a bullish reversal pattern that typically appears after a downtrend.
- Characteristics:
- Small body near the top of the range.
- Long lower shadow at least twice the size of the body.
- Little to no upper shadow.
- Interpretation:
- Indicates that sellers pushed prices lower during the session, but buyers regained control and pushed the price back up near the opening level.
- Significance:
- Suggests a potential trend reversal to the upside, especially when confirmed by higher trading volume and a bullish follow-up candle.
Inverted Hammer: An inverted hammer is also a bullish reversal pattern but has a different structure.
- Characteristics:
- Small body near the bottom of the range.
- Long upper shadow at least twice the size of the body.
- Little to no lower shadow.
- Interpretation:
- Indicates that buyers attempted to push the price higher but faced resistance. However, the failure of sellers to sustain lower prices hints at potential bullish momentum.
- Significance:
- Often appears after a downtrend and signals a possible trend reversal when confirmed by subsequent bullish price action.
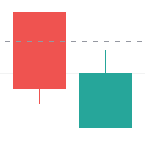
Doji: A doji represents market indecision, where the opening and closing prices are nearly the same.
- Types of Doji:
- Standard Doji: Minimal body with small wicks.
- Long-Legged Doji: Long upper and lower shadows, indicating significant price volatility.
- Dragonfly Doji: Long lower shadow and no upper shadow, suggesting potential bullish reversal.
- Gravestone Doji: Long upper shadow and no lower shadow, signaling potential bearish reversal.
- Characteristics:
- Reflects a balance between buyers and sellers.
- Commonly found at turning points in the market.
- Significance:
- At the top of an uptrend: Indicates a potential reversal to the downside.
- At the bottom of a downtrend: Signals potential bullish reversal.
Summary of Their Roles in Analysis:
- Masubuse: Confirms strong directional trends.
- Hammer: Bullish reversal after a downtrend.
- Inverted Hammer: Bullish reversal but requires confirmation.
- Doji: Signals indecision and potential reversals or continuation depending on the context.
Patterns in Technical Analysis: W and M Patterns
Patterns in technical analysis provide traders and investors with tools to predict future price movements based on historical trends. Among these patterns, the “W” and “M” formations are particularly significant, often signalling potential reversals or continuations in market trends. This blog delves into these patterns, explaining their structure, significance, and how to trade them effectively.
Understanding the W Pattern
The “W” pattern, also known as a double bottom, is a bullish reversal pattern that indicates a potential upward price movement. It forms after a downtrend and signals that selling pressure is waning, paving the way for buyers to take control.
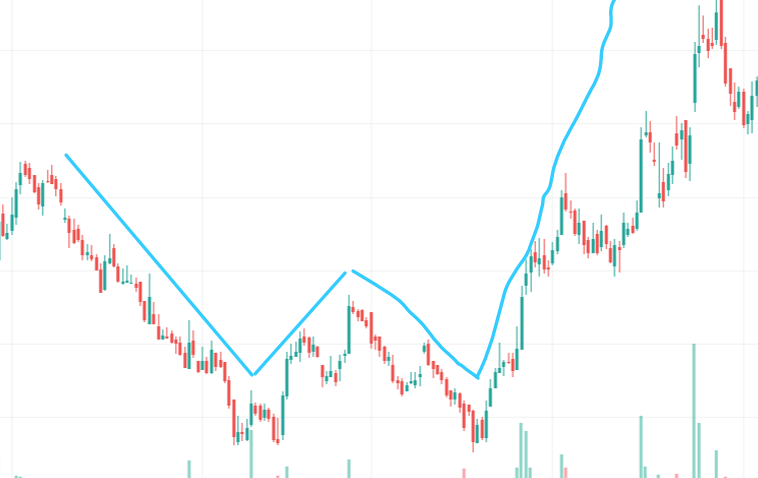

Structure of the W Pattern
- First Bottom: The price hits a low point, indicating strong selling pressure. This is followed by a short rebound as buyers enter the market.
- Pullback to Resistance: The price rises but fails to break a significant resistance level, leading to another drop.
- Second Bottom: The price reaches a similar low as the first bottom but often with reduced selling volume, signalling weakening bearish momentum.
- Breakout: After the second bottom, the price rallies again, breaking above the resistance level and confirming the pattern.
Key Characteristics
- Shape: Resembles the letter “W.”
- Volume: Higher trading volume during the breakout above resistance confirms the validity of the pattern.
- Time Frame: The two bottoms can form over different time frames, ranging from minutes (for intraday traders) to weeks or months (for swing and position traders).
Trading the W Pattern
- Entry Point: Enter the trade when the price breaks above the resistance level formed between the two bottoms.
- Stop-Loss: Place a stop-loss below the second bottom to minimize risk.
- Profit Target: Measure the distance between the lowest point of the pattern and the resistance level, then project this distance upward from the breakout point to set a profit target.
Understanding the M Pattern
The “M” pattern, or double top, is a bearish reversal pattern that indicates a potential downward price movement. It forms after an uptrend and signals that buying pressure is diminishing, allowing sellers to dominate.
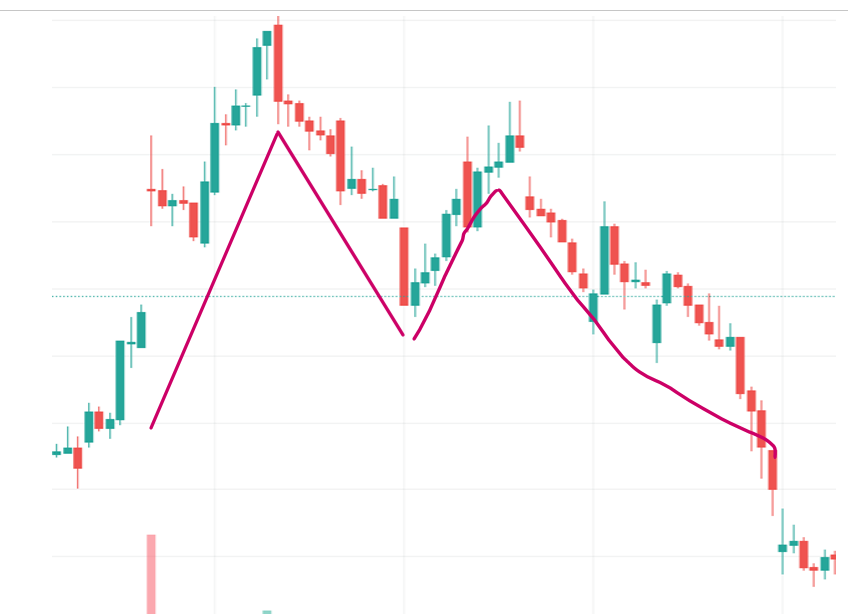

Structure of the M Pattern
- First Peak: The price reaches a high point, reflecting strong buying interest. This is followed by a pullback as sellers enter the market.
- Pullback to Support: The price declines but finds support at a key level, leading to another rally.
- Second Peak: The price rises again but fails to surpass the first peak, often accompanied by lower buying volume.
- Breakdown: After the second peak, the price falls, breaking below the support level and confirming the pattern.
Key Characteristics
- Shape: Resembles the letter “M.”
- Volume: Increased volume during the breakdown below support confirms the validity of the pattern.
- Time Frame: Like the W pattern, the two peaks can form over different time frames.
Trading the M Pattern
- Entry Point: Enter the trade when the price breaks below the support level formed between the two peaks.
- Stop-Loss: Place a stop-loss above the second peak to limit potential losses.
- Profit Target: Measure the distance between the highest point of the pattern and the support level, then project this distance downward from the breakdown point to set a profit target.
Why W and M Patterns Are Important
- Ease of Identification: These patterns are visually distinct and relatively easy to spot on price charts.
- High Reliability: When confirmed with volume and other indicators, W and M patterns often lead to accurate predictions.
- Versatility: They can be applied across various time frames and markets, making them useful for all types of traders.
Tips for Trading W and M Patterns
- Confirm with Volume: Always look for a spike in volume during the breakout (W pattern) or breakdown (M pattern) to validate the pattern.
- Use Complementary Indicators: Combine patterns with indicators like RSI, MACD, or moving averages to enhance accuracy.
- Be Patient: Wait for a clear breakout or breakdown before entering a trade. Premature entries can lead to losses.
- Back test Your Strategy: Test the effectiveness of these patterns on historical data to understand their reliability in your chosen market.
Examples from the Indian Stock Market
W Pattern Example
- Stock: Tata Steel
- Scenario: After a downtrend, Tata Steel’s price formed two bottoms around ₹100, with a resistance at ₹120. Upon breaking above ₹120 with high volume, the stock rallied to ₹140, completing the W pattern.
M Pattern Example
- Stock: Reliance Industries
- Scenario: After an uptrend, Reliance Industries’ price formed two peaks near ₹2,500, with support at ₹2,400. Upon breaking below ₹2,400, the stock declined to ₹2,200, confirming the M pattern.