The stock market follows distinct patterns that traders and investors use to predict future price movements. Recognizing these patterns can help make informed decisions and maximize gains. Some of the most common patterns include the rising parallel channel, falling parallel channel, head and shoulders, cup and handle, and bull flag. Understanding these formations provides valuable insight into market trends, helping traders anticipate potential breakouts or reversals. In this blog, we will explore each pattern in detail, discuss their significance, and provide practical examples to enhance understanding.
1. Rising Parallel Channel
A rising parallel channel, also known as an ascending channel, is a bullish pattern where the price consistently makes higher highs and higher lows within parallel trendlines. This pattern indicates a strong uptrend and is often used to identify potential buy opportunities if it breaks resistance & if it breaks support then it should be a breakout , not to trade situation.
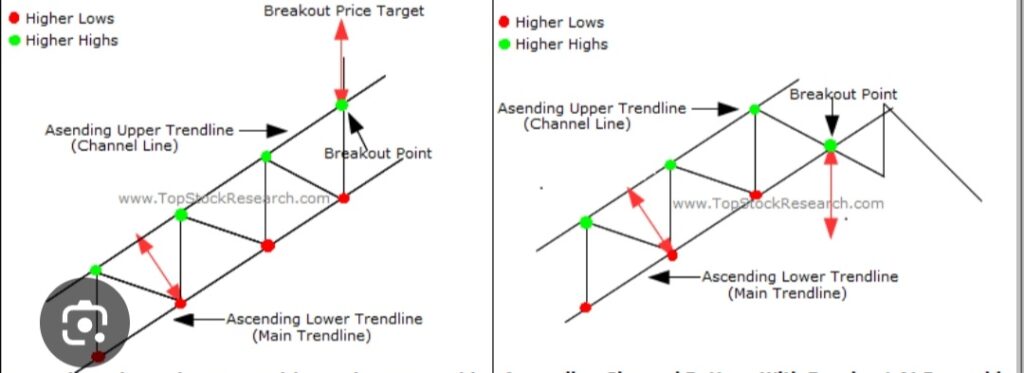

Key Characteristics:
- Price moves between two upward-sloping parallel lines.
- Support and resistance levels are clearly defined.
- Volume often increases as the price approaches resistance.
Example:
Consider a stock that moves from $50 to $60 while forming a rising parallel channel. As long as the price stays within the channel, traders may buy at support levels and sell near resistance.
2. Falling Parallel Channel
A falling parallel channel is a bearish pattern where the price consistently makes lower highs and lower lows within downward-sloping trendlines. This pattern signals a continued downtrend but can also present buying opportunities when the price breaks out above resistance & will be consider as bearish if it breakdown support.
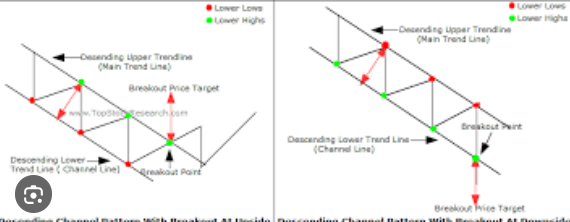

Key Characteristics:
- Price moves within two downward-sloping parallel lines.
- Resistance levels act as selling points.
- Volume decreases during the decline but may spike during a breakout.
Example:
A stock declining from $100 to $80 while following a falling channel could indicate a bearish trend. Traders may short the stock at resistance and look for reversal signals near support.
3. Head and Shoulders Pattern
The head and shoulders pattern is a powerful reversal formation that signals a trend change. It consists of three peaks: a higher middle peak (head) and two lower peaks (shoulders).


Key Characteristics:
- A peak (left shoulder) followed by a higher peak (head) and another lower peak (right shoulder).
- A neckline that connects the two valleys.
- A breakdown below the neckline confirms the reversal.
Example:
If a stock rises to $150, then drops to $130, rises again to $160, falls to $130, and rises once more to $145 before breaking below $130, it forms a head and shoulders pattern, indicating a bearish reversal.
4. Cup and Handle Pattern
The cup and handle pattern is a continuation pattern that resembles a tea cup. It indicates a period of consolidation followed by a bullish breakout.
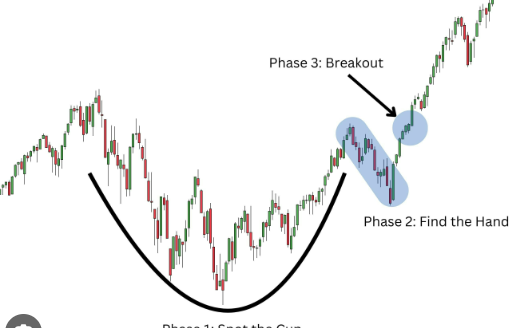

Key Characteristics:
- A rounded bottom (cup) forms over a period of time.
- A small consolidation (handle) follows the cup.
- A breakout above the handle confirms the pattern.
Example:
If a stock moves from $50 to $60, then dips slightly before rallying past $60, it completes a cup and handle pattern, signaling further bullish momentum.
5. Bull Flag Pattern
The bull flag is a continuation pattern that forms after a strong upward move, followed by a slight pullback before resuming its trend.
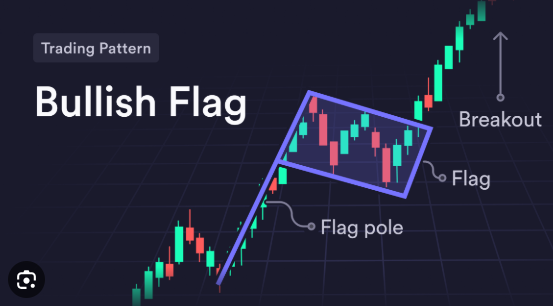

Key Characteristics:
- A strong upward price movement (flagpole).
- A brief consolidation or downward sloping flag.
- A breakout above the flag confirms the pattern.
Example:
A stock surging from $20 to $30, then consolidating to $28 before breaking out past $30, is a textbook bull flag formation.
6. Inverted Hammer
The inverted hammer is a candlestick pattern that signals a potential reversal in a downtrend.
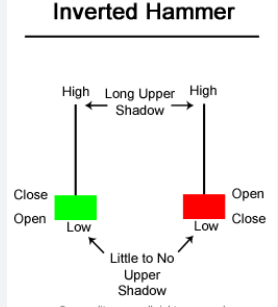

Key Characteristics:
- A small real body at the bottom of the trading range.
- A long upper wick, indicating rejection of higher prices.
- Confirmation is needed with a subsequent bullish candle.
Example:
If a stock falls from $75 to $60 and then forms an inverted hammer at $60, it suggests a potential bullish reversal if the next candle is strong.
7. Triangle Patterns (Ascending, Descending, Symmetrical)
Ascending Triangle:
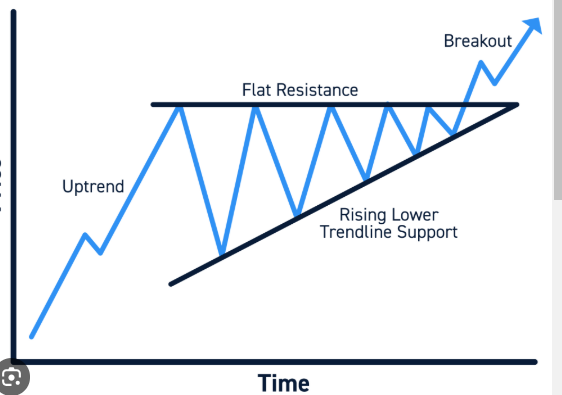

- A horizontal resistance level with rising lows.
- A breakout above resistance signals bullish momentum.
Descending Triangle:
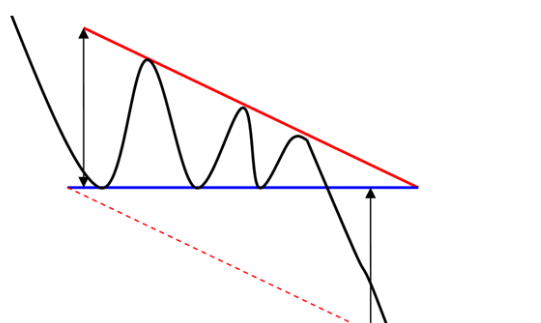

- A horizontal support level with lower highs.
- A breakdown below support signals bearish momentum.
Symmetrical Triangle:
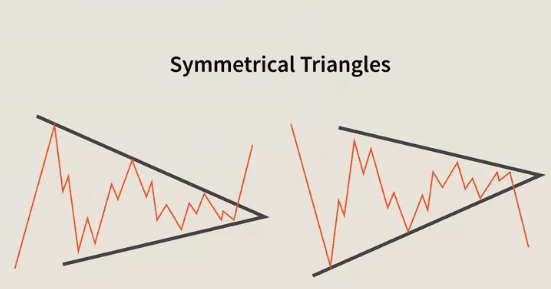

- Converging trendlines with no clear bias.
- A breakout in either direction confirms the pattern.
Example:
If a stock moves between $100 and $110 but forms higher lows, it’s forming an ascending triangle. A breakout above $110 signals a strong uptrend.
8. Horizontal Line Pattern
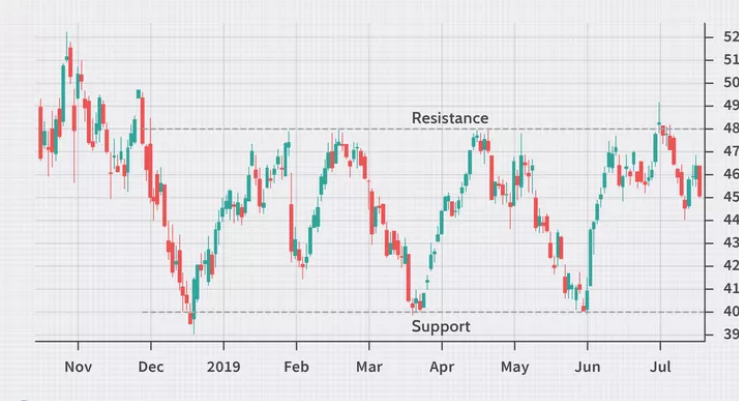

A horizontal line pattern occurs when a stock trades within a defined price range for an extended period.
Key Characteristics:
- Price remains between strong support and resistance levels.
- Breakouts indicate the beginning of a new trend.
Example:
A stock trading between $90 and $100 for several weeks, then breaking above $100, signals a bullish breakout.
Conclusion
Understanding stock market patterns like the rising parallel channel, falling parallel channel, head and shoulders, cup and handle, and bull flag can significantly improve trading strategies. Each pattern provides clues about future price movements and potential breakouts. By recognizing these formations and analyzing market conditions, traders can make better-informed decisions and increase their chances of success in the stock market.